What is the best tool to test a webpage’s performance?
I have run a lot of performance tests, having been focusing on this for years, particularly the last year and a half. I have used a lot of tools for this that are commonly used in the industry. I have found that of the many tools available for performance testing a website, only one in my experience seems to be an all-encompassing tool which also provides accurate results.
I highly recommend the WebPageTest tool. It offers the most locations to test from, it offers the most accurate metrics (largely due to its ability to run multiple tests to the webpage at one time, and presents the data as a median number for each metric, while also showing results from each individual test too), and it also offers the most simulation browsers. This means you can test from nearly anywhere in the world to the web server, with any combination of web browser clients (i.e. mobile devices/browsers, tablets, desktop, etc), and get the most accurate numbers of them all. The one downside is just the interface itself… it’s a bit dated looking, but it’s a solid tool and in my opinion the best of them all. It’s free too!
How to best use the WebPageTest tool?
There are some items to keep in mind when initiating a test on the WebPageTest tool. Be sure to keep these in mind:
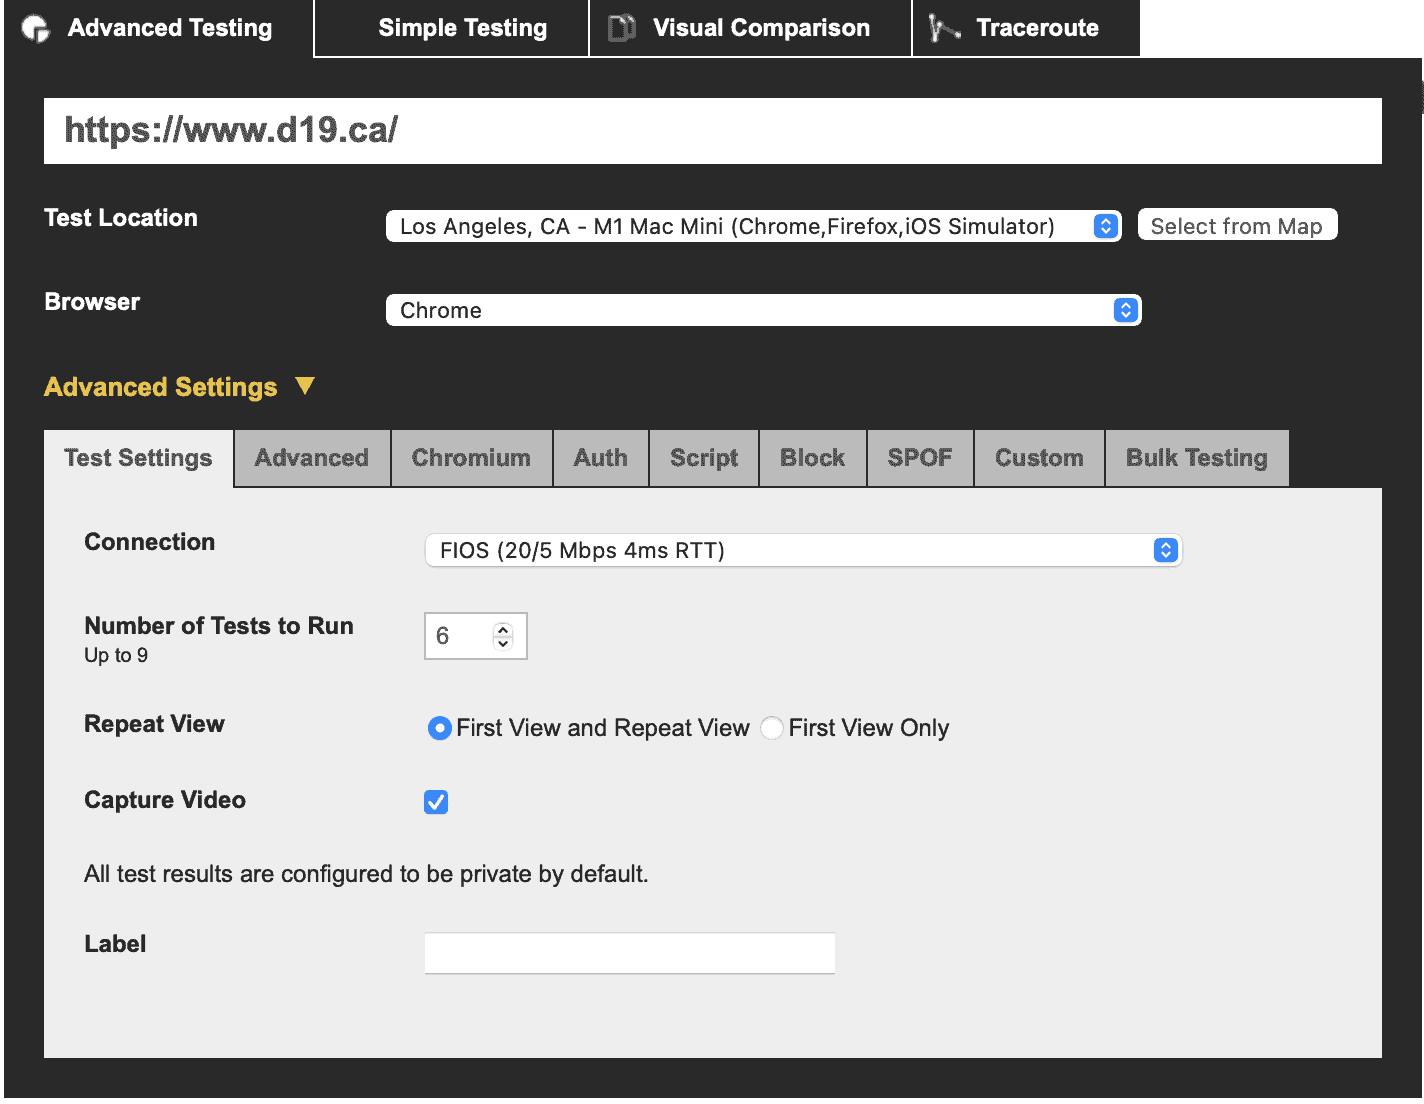
- The test URL should be the full-formed URL including the protocol (HTTPS if using SSL), such as this website URL: https://www.d19.ca/
- Change the Test Location to nearest the audience viewing the website
- When testing for my clients, I typically use the “Los Angeles, CA – M1 Mac mini” location to represent the audiences coming from the west coast.
- Change Browser to the browser you want to test with, typically Chrome (especially if you want to see the Google Web Vital scores) or mobile device simulators for people browsing to the website on a mobile phone
- Expand the Advanced Settings and set the following:
- Connection should be set to represent the general internet speed the clients are using (in most cases this will be the FIOS 20/5 connection type, or LTE)
- Number of Tests to Run should be somewhere between 6 and 9 to get a better / more accurate result. Keep in mind the test takes a little longer the more runs that are used
- Select First & Repeat View to get an accurate number for first load (uncached) and second load (cached)
- Capture Video should be enabled to get an accurate Speed Index score
Understanding the results
Once you’ve run your test, you should see the following near the top of the output showing the median results between all the test runs. It should look similar to this (check the test results out here for this website):
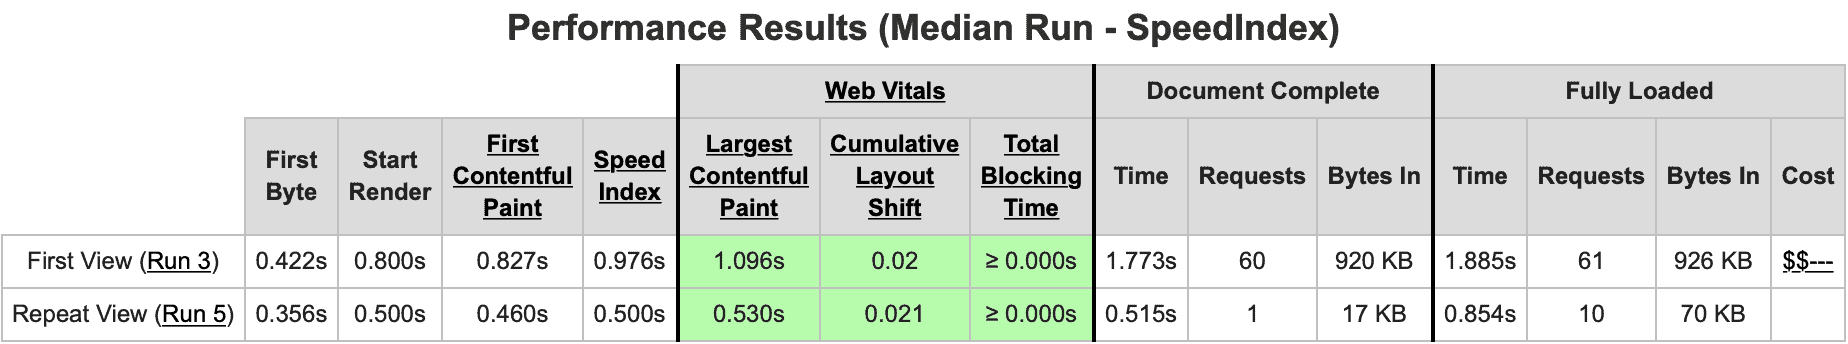
The First View row is how long it takes uncached (i.e. the very first time the website was loaded in this browser). The Repeat View is how long it takes cached. Cached means the browser has loaded the webpage once before, and has retained some of the items in its own cache. The items that are cached are set by the web server sending the files to the browser client.
First Byte is how quickly the client received its first acknowledgement from the web server for the request. In the example above, it means it took about 400 milliseconds to respond.
Start Render is how quickly the web browser was able to start rendering the content in the browser.
First Contentful Paint is how quickly it was able to complete drawing/rendering the first object on page.
FCP measures how long it takes the browser to render the first piece of DOM content after a user navigates to your page. Images, non-white
canvaselements, and SVGs on your page are considered DOM content; anything inside an iframe isn’t included.
Speed Index is a metric for how quick the page loads visually (i.e. all of the “above-the-fold” content is displayed).
Speed Index measures how quickly content is visually displayed during page load. Lighthouse first captures a video of the page loading in the browser and computes the visual progression between frames. Lighthouse then uses the Speedline Node.js module to generate the Speed Index score.
The Web Vitals section is a collection of metrics which Google calls Web Vitals and is going to be a much higher ranking factor starting on May 6th, 2021. If the figures are in green, then they meet Google’s requirements for their Web Vitals which imply a very well performing site. If they are in orange, then they have room for improvement, and if they are red then Google deems them to be far too slow. Ideally, all three metrics will be green.
Largest Contentful Paint is how long I takes to render the largest section of the webpage “above-the-fold”.
LCP measures when the largest content element in the viewport is rendered to the screen. This approximates when the main content of the page is visible to users.
Cumulative Layout Shift is how much a webpage shifts as new elements are loaded.
CLS measures the sum total of all individual layout shift scores for every unexpected layout shiftthat occurs during the entire lifespan of the page.
Total Blocking Time is how long it takes before a webpage is interactive by a user.
TBT measures the total amount of time that a page is blocked from responding to user input, such as mouse clicks, screen taps, or keyboard presses.